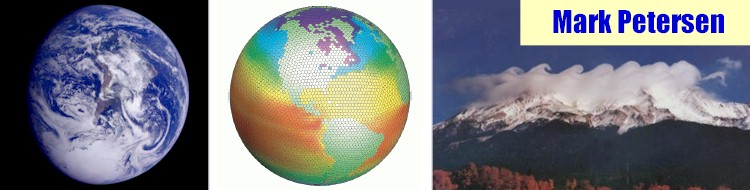
What are these images?
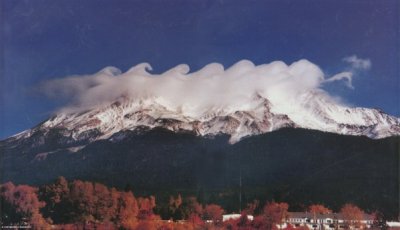 Billow Clouds on Mt. Shasta Billow clouds are created from instability associated with air flows having marked vertical shear and weak thermal stratification. The common name for this instability is Kelvin-Helmholtz instability. These instabilities are often visualized as a row of horizontal eddies aligned within this layer of vertical shear. Billow clouds are created in the upward branch of each of the eddies if the air within this branch has a high enough relative humidity that, upon lifting, the air parcel reaches saturation. Individual billow clouds generally have life times of a few minutes. The presence of billow clouds provides a visible signal to aviation interests of potentially dangerous turbulence. 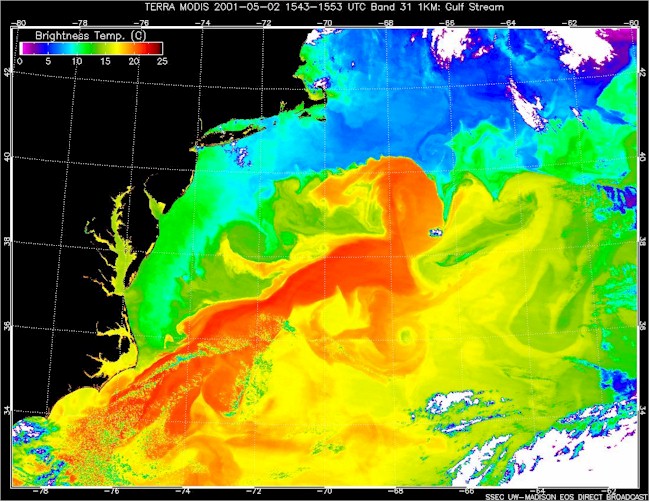 Gulf Stream On May 2, 2001, the Moderate-resolution Imaging Spectroradiometer (MODIS) obtained this spectacular image of the Atlantic Ocean's Gulf Stream. The false colors in the image represent "brightness temperature" observed at the top of the atmosphere. The brightness temperature values represent heat radiation from a combination of the sea surface and overlying moist atmosphere. The red pixels in this image show the warmer areas (approaching 250C), greens are intermediate values (12-130C), and blues are relatively low values (less than 100C). Notice the considerable detail in the swirls and gyres of the current patterns in the Gulf Stream. Source: NASA's Visible Earth 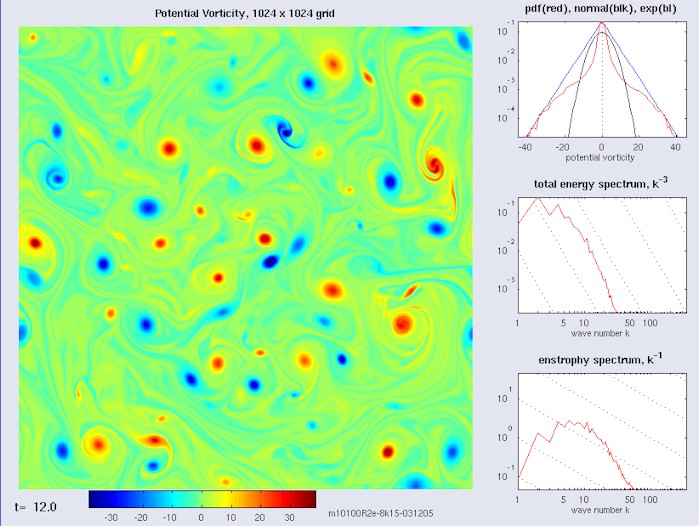 Computer Simulation of Rotating Fluid This is an image of a 2D vorticity run-down experiment produced by the quasi-geostrophic model I created for my thesis. Red is positive vorticity and blue is negative. Like-signed vortices merge while opposite signed vortices can translate in pairs. Notice the similarities to the Gulf Stream image above. 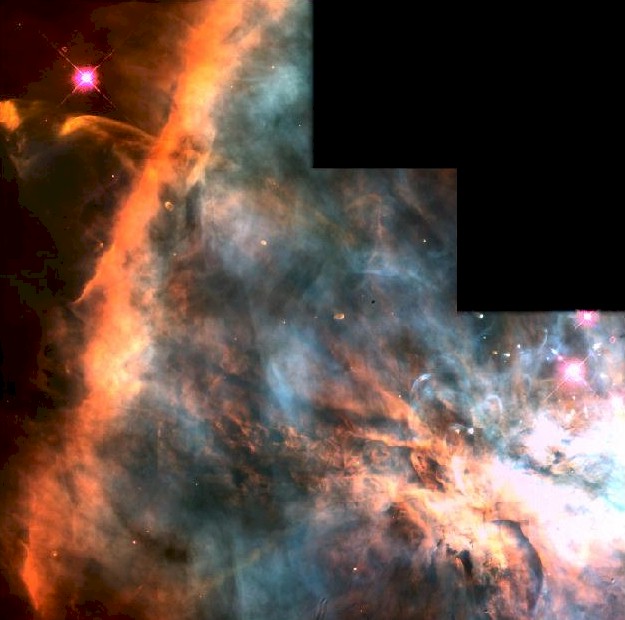 The Great Orion Nebula This is one of the nearest regions of very recent star formation (300,000 years ago). The nebula is a giant gas cloud illuminated by the brightest of the young hot stars at the top of the picture. Many of the fainter young stars are surrounded by disks of dust and gas that are slightly more than twice the diameter of the Solar System. The great plume of gas in the lower left in this picture is the result of the ejection of material from a recently formed star. The brightest portions are "hills" on the surface of the nebula, and the long bright bar is where Earth observers look along a long "wall" on a gaseous surface. The diagonal length of the image is 1.6 light-years. Red light depicts emission in Nitrogen; green is Hydrogen; and blue is Oxygen. The Orion Nebula star-birth region is 1,500 light-years away, in the direction of the constellation Orion the Hunter. The image was taken on 29 December 1993 with the HST's Wide Field and Planetary Camera 2. Source: NASA's Hubble Gallery 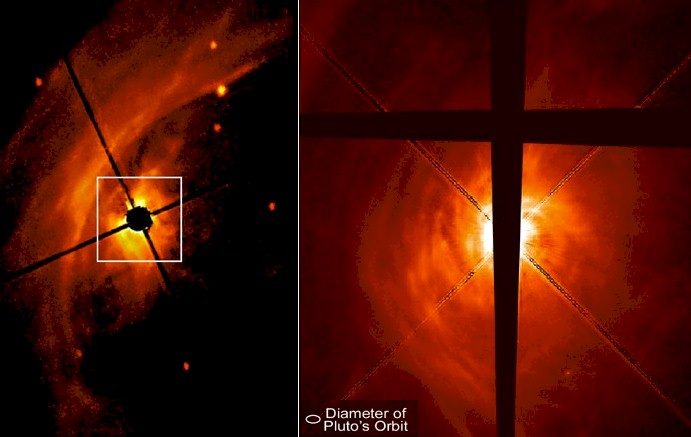 Protoplanetary Disk The Hubble telescope has snapped a nearly face-on view of a swirling disk of dust and gas surrounding a developing star called AB Aurigae. The image, taken in visible light by the Space Telescope Imaging Spectrograph, shows unprecedented detail in the disk, including clumps of dust and gas that may be the seeds of planet formation. Normally, a young star's bright light prevents astronomers from seeing material closer to it. That's why astronomers used a coronograph in these two images of AB Aurigae to block most of the star's glare. The rest of the disk material is illuminated by light reflected from the gas and dust surrounding the star. The image on the left represents the best ground-based coronographic observation of AB Aurigae. The star resides in a region of dust clouds ? the semicircular-shaped material to the left of the star. The Hubble telescope image on the right shows a windowpane-shaped occulting bar. The illuminated material surrounding the star is the dust disk. Source: NASA's Hubble Gallery 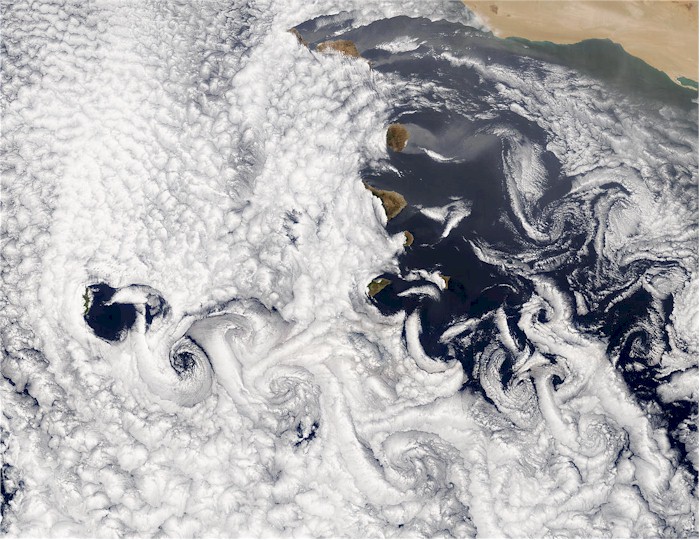 Vortex Street from Canary Islands A vortex street often occurs when cloud formations over the ocean are disturbed by wind passing over land or another obstacle. In this true-color Moderate Resolution Imaging Spectroradiometer (MODIS) image from July 5, 2002, marine stratocumulus clouds have arranged themselves in rows, or streets, which are usually parallel to the direction of wind flow. Downwind of obstacles, in this case, the Canary Islands off the west African coast, eddies create turbulent patterns called vortex streets. Source: NASA's Visible Earth 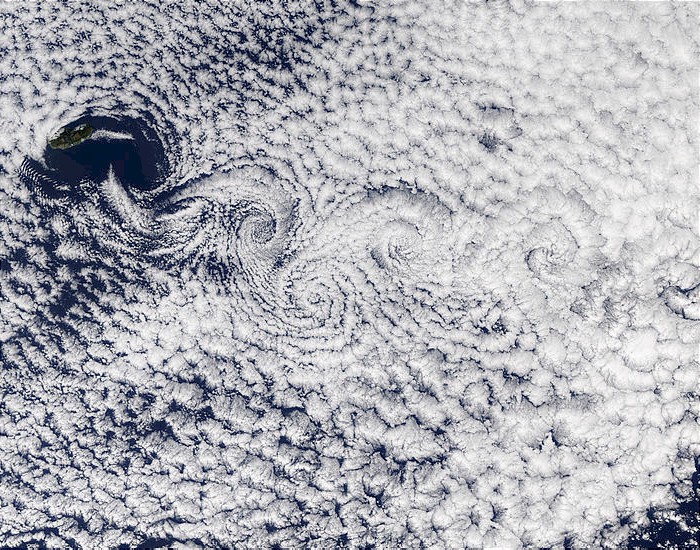 Vortex Street Near Madeira Island A vortex street streams slightly southeast of the Ilha da Madeira (Madeira Island) in this true-color Terra MODIS image acquired December 1, 2002. A vortex street forms when clouds over the ocean are disturbed by winds passing over land or other above-sea-surface obstacles, in this case the Ilha da Madeira. The southeastern movement of the low-level winds caused the clouds to line up in the same direction, called a street, and the wind's passage over the islands caused the swirls, called vortices. The particular kind of clouds forming the vortex street is referred to as "closed cell". These cells, or parcels of air, often occur in roughly hexagonal arrays in a layer of air that behaves like a fluid (as often occurs in the atmosphere) and begins to convect due to heating at the base or cooling at the top. In these closed cell clouds, warm air is rising at their centers and sinking around the edges to create this honeycomb-like pattern. (Courtesy GSFC/NASA) Source: NASA's Visible Earth 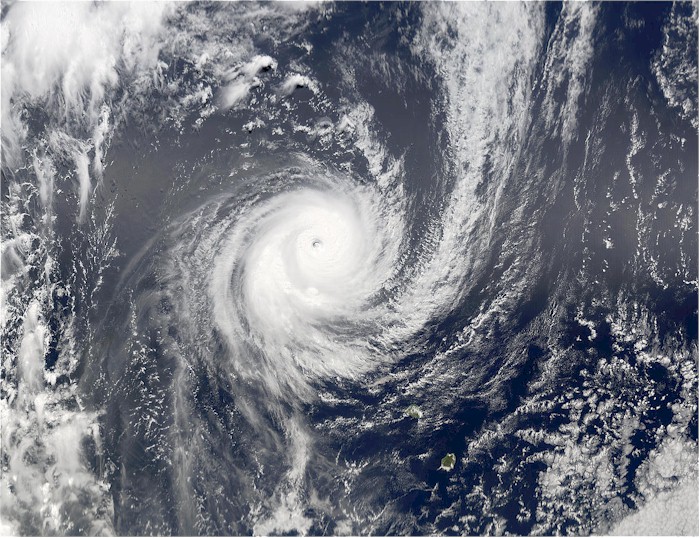 Cyclone Dina This MODIS image shows Tropical Cyclone 10S (Dina) northeast of Mauritius and Reunion Islands in the Indian Ocean. This image was captured on January 20, 2002. MODIS (or Moderate Resolution Imaging Spectroradiometer) is a key instrument aboard the Terra (EOS AM) and Aqua (EOS PM) satellites. Terra's orbit around the Earth is timed so that it passes from north to south across the equator in the morning, while Aqua passes south to north over the equator in the afternoon. Terra MODIS and Aqua MODIS are viewing the entire Earth's surface every 1 to 2 days, acquiring data in 36 spectral bands, or groups of wavelengths (see MODIS Technical Specifications). These data will improve our understanding of global dynamics and processes occurring on the land, in the oceans, and in the lower atmosphere. MODIS is playing a vital role in the development of validated, global, interactive Earth system models able to predict global change accurately enough to assist policy makers in making sound decisions concerning the protection of our environment. Source: NASA's Visible Earth 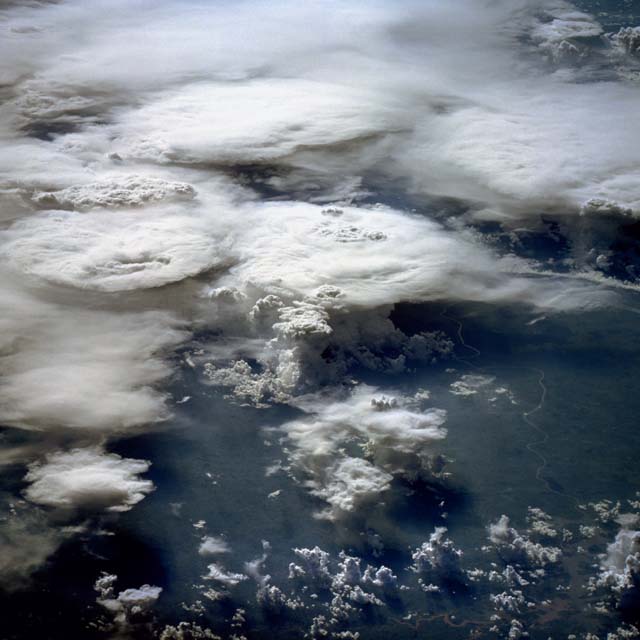 Cumulus Cloud Tops This oblique photograph, acquired in February 1984 by an astronaut aboard the space shuttle, shows a series of mature thunderstorms located near the Parana River in southern Brazil. With abundant warm temperatures and moisture-laden air in this part of Brazil, large thunderstorms are commonplace. A number of overshooting tops and anvil clouds are visible at the tops of the clouds. When the rising cumulus columns meet the tropopause, or base of the stratosphere, at about 15,000 kilometers (50,000 feet), they reach a ceiling and can no longer rise buoyantly by convection. The stable temperature of the stratosphere suppresses further adiabatic ascent of moisture that has been driven through the troposphere by the 5-6.8 degree/kilometer (8-11 degree/mile) lapse rate. Instead, ice clouds spread horizontally into the extended cirrus heads seen in this photograph, forming the "anvil heads" that we identify from the ground. The finer, feathery development around the edges of some of the thunderheads is glaciation - water vapor in the cloud is turning to ice at high altitude. Storms of this magnitude can drop large amounts of rainfall in a short period of time, causing flash floods. (Courtesy NASA-JSC) Source: Clouds from Space  Jet Stream Cirrus This photograph taken from about 320 kilometers (200 miles) above the Earth shows a band of cirrus clouds produced by a westerly jet stream that stretches across the Red Sea from Sudan to Saudi Arabia. The contained uniformity of the cloud formation reflects the narrow track of the jet stream moving from left to right across the frame. The shuttle photo shows that the cloud band comprises a series of distinct and precisely spaced roll clouds. These are created by a rolling motion in the upper level air current. (Courtesy LPI/NASA. Picture #13-32-1099) Source: Clouds from Space 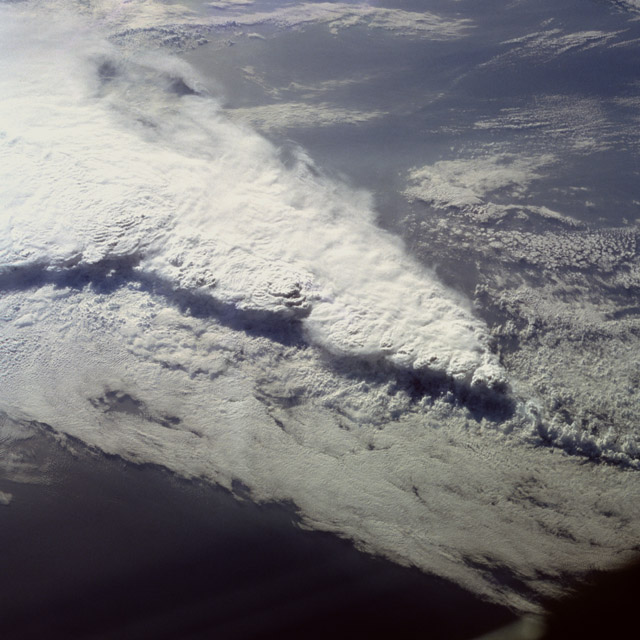 Florida Squall Line This spectacular, low-oblique photograph shows a convective line of thunderstorms associated with a passing cold front over Florida. A shadow from the height of the thunderstorms, caused by early morning sunlight, can be seen traversing the scene southwest to northeast. The clouds in the storm system rise to about 16,500 meters (55,000 feet). The V-shaped cloud structure is normally associated with cold fronts that cross the Gulf of Mexico and Florida in late winter and early spring. Severe thunderstorms and tornadoes usually occur with this type of storm system. At the time this photograph was taken, weather stations across Florida reported severe thunderstorms, strong winds, hail, torrential rains, and numerous tornadoes. (Courtesy NASA) Source: Clouds from Space |